
Americans seldom experience war directly — World War II was the last time a war reached US soil. Since then, our wars have been experienced much more indirectly. No ration books appeared during Vietnam, no mass retooling of factories happened for Desert Storm, and daily life seems largely unchanged despite a decades-long War on Terror. The Iran War seems to be the same, at least in these respects.
All wars still impose costs on ordinary Americans, of course; they simply arrive in quieter ways. Enter every trip to the gas station since February 28th.
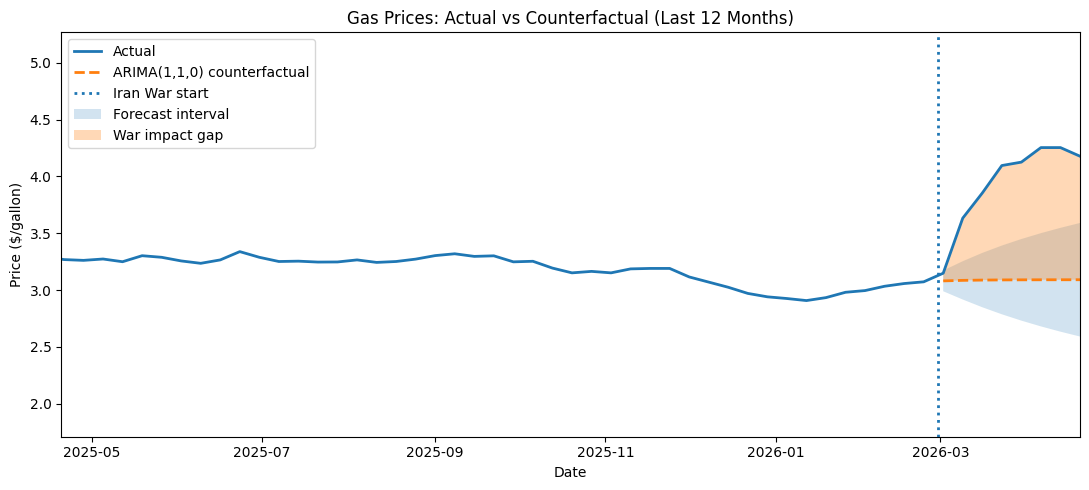
For millions of Americans, the Iran War entered their lives not through the battlefield, but through the gas pump. Since the onset of the Iranian conflict, gasoline prices across the United States have risen sharply. Gas prices notoriously fluctuate, so the question becomes whether the recent movement reflects ordinary fluctuations or a deeper shift tied to the conflict.
Using weekly national data from the US Energy Information Administration and a simple counterfactual time-series model, we can consider a limited answer. Gasoline prices appear to have moved well above their expected path following the outbreak of the war. The model suggests a premium averaging about $0.85 per gallon, exceeding $1.15 at its peak relative to a no-war baseline.
This estimate does not, by itself, prove causation. But the timing, magnitude, and persistence of the gap strongly align with a war-related shock sent through the global oil market.
The model used here — an ARIMA(1,1,0) specification — captures the internal dynamics of gas prices using their past behavior. Simply, the model assumes that, absent new shocks, prices tend to follow their recent trajectories (with some flexibility built in not worth expounding upon here). Our model is trained on only prewar data, ending in late February 2026. From that point forward, it constructs a counterfactual gas price, projecting how it would have likely evolved if those prewar dynamics had continued unchanged.
Prior to the war, the model performed well, with forecast errors remaining small. This gives us confidence in the baseline. With this in mind, when actual prices suddenly move 50 cents, then 75 cents, then over a dollar, this signals a structural break in the process the model captures, not just a forecasting error that was “missed.”
In other words, the issue is not merely that prices increased, but that they increased far beyond what recent trends would have predicted. And this break appeared almost immediately after the conflict began.
Starting in early March, gas prices rose above the model’s expectation. By mid-March, the gap had widened immensely, and by early April, it reached its peak. When considering the first couple of weeks after the beginning of the war, the gap between the observed and projected prices grew steadily, rather than manifesting as a one-time spike. Observed prices consistently exceed the model’s forecast and often lie outside the forecast’s confidence interval. This pattern strongly suggests that something changed in the underlying process generating gas prices. The timing and scale make the conflict a very plausible explanation for the break in the trend.
Oil markets are quick to transmit geopolitical shocks. A central concern since late February has been the Strait of Hormuz, one of the most important chokepoints in the global energy economy. The International Energy Agency noted its importance, with roughly one-fifth of global oil consumption passing through the strait daily (until recently, that is).
None of this is surprising. As F.A. Hayek pointed out, prices “act to coordinate the separate actions of different people,” transmitting information about changing conditions across the economy. When future expectations for supply shift, so do prices. The higher price reflects new information regarding scarcity and the anticipation of its continuation. The gradual widening in the data is consistent with this mechanism.
The per-gallon increase may seem modest in isolation, but scale turns these cents into billions.
The United States consumes hundreds of millions of gallons of gasoline every day. A premium of about $0.85 per gallon implies that American consumers are collectively spending hundreds of millions of dollars more per day on fuel than they would have otherwise. Over the first few weeks of the conflict alone, this additional spending reached billions of dollars.
Families do not experience these costs as abstract statistics. They are experienced through tighter budgets and foregone choices. The extra money spent on gasoline is money no longer available for restaurants, entertainment, savings, debt repayment, or other household necessities. The burden falls hardest on the working class, long-distance commuters, delivery drivers, and rural households for whom driving is not optional.
The goal here is not to claim perfect certainty. No statistical model can fully isolate a geopolitical cause in the way we might hope. Other factors, like policy responses and broader market conditions, also obviously influence prices.
The evidence, however, points in a clear direction. Prices broke from their prior trajectory immediately after the conflict began. The gap is large, persistent, and widening over time, not dissipating. Taken together, then, these facts do support a straightforward conclusion: the recent rise in gasoline prices appears closely connected to the Iran War. This rise has imposed meaningful costs on both individual households and the broader economy.
Gasoline prices, through their adjustments according to supply and demand, translate distant geopolitical events into immediate economic costs. The Iran War may be fought thousands of miles away, but part of its burden is now being carried by American households every time they pull into a gas station. The model suggests that the war-related price premium added close to a dollar per gallon at its peak.
For most Americans, the war does not feel immediate or personal. Until they fill up.